Managing a Test & Learn Program

Effective performance marketing & optimization is critical to the success of every program. We feel the details of our success come down to the right people with a valid process using capable tools. Within Test and learn the gap between concept and actual implementation often seems to be the true difference between success and failure. With has years of extensive testing expertise and bening comfortable acting as the lead or support on any project. The steps of our process are outlined below:

1) Current State Assessment – Our testing process always begins with current state assessments, reviewing assets, campaigns and general data to determine what is meeting objectives or not. Baselines and benchmarks are also determined at this stage. A big part of this is understanding historical data. Most companies will try and find value from simple business experiments. It’s easier to draw the conclusions using data generated through experiments than by studying historical transactions. It is important to understand both, to avoid swim lane measurements and not look at external data.

2) Define Objectives – in this stage we identify business/financial, customer, branding and operational objectives via a testing measurement plan. Key learning objectives are defined and aligned against business objectives.

3) Idea Intake and Brainstorm – Theory & Hypothesis Creation -This leads to the 2nd phase of the process with is the idea intake after the review of data. Theories and hypotheses on why things are happening will be discussed between a variety of groups involved. At this point no idea is a bad idea, brainstorming should include easy and complicated theories. After a variety of theories are discussed and an ideas generated that include Creative, UX, content, performance CTA’s, Design style, Site structure and more, hypotheses can be put together for the tests. A hypothesis is created in three steps 1) Theory is created on what is happened 2) The quantifiable metrics in question are determined 3) Hypothesis will include the theory, quantifiable metrics and the delta determined on the test.

4) Test Plan Matrix – Once Hypotheses are determined, the test details will need to be outlined to ensure the test is actionable, significant and all details are communicated for alignment. Running a business experiment requires two things: a control group and a feedback mechanism. These will be outlined within the test plan matrix. Feedback mechanism metrics include behavioral and perceptual metrics. Behavioral metrics measure actions such as actual purchases or online engagement. Perceptual measures indicate how customers think they will respond to your actions. This form of feedback is obtained via surveys, focus groups or other forms of market research. These measures are useful in diagnosing intermediate changes in customers’ decision processes.

5) Prioritization – a unique testing scorecard will be created based on criteria important to success. We will score all tests against the pre-determined criteria and rank tests in order

6) POD Calendar Client Approval – tests will be placed in ‘Pods’ or groups of tests to be executed at a time. This is done to ensure clean and agile testing. Certain tests should not be run at concurrent times. Also, a defined 6 month schedule does not work well because out of running tests, new theories and tests may be generated and might be prioritized above others. By using a ‘Pod’ calendar, we are able to be agile and provide clients with the most impactful testing possible. This Pod calendar would be reviewed and approved on a regular pre-determined basis.

7) Execution – Go live! We have a strict Q/A process on the execution stage which will minimize error and increase launch times and quality of data.

8) Analysis & Optimization – Ongoing analysis and reporting will be communicated throughout testing. It is important to also have a clear start and end to each analysis, as structured learning is key to the data being generated.

9)Test Evaluations -Once tests reach statistical significance, an analysis which includes both quantitative and qualitative approaches.

10)Promotion of Winners – Test winners should be promoted live and used as the new ‘Baseline’.

11) Innovation – The cycle continues back to to first step. Through the evaluation and promotion of winning tests, innovative brainstorming should follow to determine new theories and tests. Innovation occurs when research and insights and intuition work as a team.

Given the suggested process, it takes three key groups which are: People, Process and Technology. It is extremely important for this to be outlined and strictly followed throughout testing. This will eliminate error and assure good testing, which is critical as any errors in testing could be costly given the time it takes tests to be completed. Test and Learn is the Core of Analysis. In addition to the process for effectively driving continuous learning, testing has a tight bound with analysis. To learn what delivers business value, the focus has to be on the business questions. Te experience to take the lead or provide support within any or all of these groups. We can provide strategic support in creating and determining the quality assurance of each test. We have the experience to collaborate with various groups to ensure the process is followed and communicated, including the key stakeholders from appropriate parties. We also have the implementation and technology experience and could execute testing and provide reporting and analysis. Testing is a method and science of optimization where the performance of variables is compared against each other real time in order to measure the effect that each version has on your conversion rate. Testing never stops, findings from each test feed into other marketing channels, improve ROI, and are leveraged when devising the next test. The expertise in any of the outlined process and the key groups to get constant testing done in required.

How should Analytics and Stratgey teams work together

Analytics and Strategy teams should not only work together on a daily basis, but should sit within same group given the organizational structure allows. This is done to ensure all analysts are ‘strategic analysts’, not just reporting specialists. Often Analytics is perceived as reporting the ‘What happened’, which generally includes a variety of metrics, trends and ad hoc numbers. In order to connect a strategy to action, you must make sure that our analytics team isn’t living in a silo far from the people within the organization that are executing on that data. I feel it is important to discover the ‘Why’ and ‘What will happen next’ as well as the ‘What’. To get to this point, groups should execute a solid process of both Quantitative and Qualitative analytics as well advanced analytics techniques using a variety tools. That means the Strategy and Analytics groups have access and communicate with the same data and tools in order to find the data your organization truly needs to innovate, try new and emerging tactics, drive customer acquisition and new revenue. From an optimization standpoint, companies may be are losing money due to an inability to translate their data into action. A solution is available once the right people, technology and process are in place. Analysis is not only graphical trend reporting, but strategic ‘data journalism’ consisting of data story telling. Our teams will not start a project unless a measurement plan is created, consisting of defined objectives, goal, KPI’s (Key Performance Indicators) that map back to the objectives, benchmarks, forecasts and finally Segments/Dimensions to provide needed granular data. Our measurement plans ensures that not only the Strategists and Analysts are aligned, but also other teams including account, creative and client are aligned as well.

Companies need data, and many times data can be easily gathered and reported against. Connecting the data to action is the next step and it’s the most critical. On a typical day, the Strategy and Analytics team’s will interact to review the previously mentioned, to determine ‘What has happened’, ‘Why it has happened’ and also use advance techniques to determine ‘What will happen next’. The teams do this with a variety of both quantitative and qualitative including Web Analytics Tools, DMPs/DSP’s, Testing technology, Heat maps, Qualitative Online User testing and much more. On a typical day, general interaction happens in the following ways:

- Review Quantitative Data analysis against the aligned measurement plan
- Identifying and prioritizing top challenges and key strategic growth opportunities based on performance
- Conduct and review comprehensive performance analysis on campaigns and/or operations, putting data models and analytics in place that provide a platform for strategic decision making
- Complete small or large scale data analysis and modeling to identify opportunities for improvement and measure the impact of initiatives to make improvements based on impact
- Generate Hypotheses and theories on performance that will be the base for future tests
- Discuss Qualitative online testing and feedback to connect with quantitative
- Find the ‘story’ in the data via data journalism
- Perform Scenario analysis – Defining problems, separating certainties from uncertainties, developing scenarios, and then using the scenarios in our planning. In Scenario Analysis, the scenarios are stories about the way the world might turn out if certain trends continue and if certain conditions are met.

Analytics are required to gather the intelligence for these daily interactions. Yet, the traditional approach of moving data to a centralized data source for analysis doesn’t work completely. Data is widely distributed, has a short shelf life, or there is just too much to move fast enough. Many companies believe that investments in digital technologies such as Digital, social, mobile, and such will provide a competitive advantage. Often times, this belief and tactic creates a lot of data for the company, but not enough actionable insights. This data if often looked at within a silo or swim lane. Aim to break the barrier between swim lane measurement and moving towards and advanced analysis (2.0) by adding in multiple data sets found outside digital tools and includes external factors such as situational and persona. By doing so, a company is better set to attribute performance, optimize and then re-allocate based on a holistic view of performance and situations. This type of analysis requires strategic discussions within multiple groups on a regular basis. This can be a core philosophy as Strategy & Analytics teams are closely connected on a daily basis, connecting data into action. We aim to provide the competitive edge on services within multi-disciplinary projects, consulting and actionable market intelligence for the newest emerging technology to generate positive ROI.

As the digital experience continues to evolve, the vision for measurement and analytics should as well.

Below I have outlined a few of the evolutions in Analytics that a company should be striving for as measurement and analytics becomes increasingly important.

Holistic Customer Centric Measurement
As technology and it’s impact on business strategy continues to rise every second, there are massive amounts of data sets being produced. With so much information available now, the ability to influence and change starts in the hands who deal with data. This is Analytics, and its role is the foundation for decision making and actionable insights for each organization.
Not only is the digital experience evolving with technological advances but the consumers/patient are also as well. The traditional consumer/patient has been joined with the digital often multichannel consumer, and as a result, operating models should contain both. Combined with the evolution of the digital experience through technology, analytics is based on investing in the right 1) People 2) Tools (Technology), and creating the right 3) Process is extremely important.

Real Time Decisioning
Many clients gauge their Marketing impact in one medium at a time. Many know how TV, Print, radio and online ads each function independently to drive conversions (ROI). However, that provides only part of the story. Our aim is to grasp the notion that ads and marketing increasingly interact, and the customer lies at the core. To become a customer-centric organization, generating the right set of data points and bringing data together correctly matters. Given, Analytics and Measurement need to generate effective connectivity, not just have fancy capabilities. Our goal is to know what actually happens as a customers/patients move from one interaction to another. This helps to offer the best customer experience. Technology & Analytics allows us to connect customer-facing and non-customer-facing (server/technology) functions. We aim to connect data with advanced analytical capabilities such as ‘predictive actions’ to enable content and technology to drive engagement dynamically based on real-time data. Marketers now have an unprecedented ability to fine-tune allocation decisions while making course corrections in real time

Advanced Analytics and Predictive
Part of analysis is developing actionable insights, which accommodates what has happened, why did it happen and determining what will happen next. Knowing what has happened is called reporting. Knowing why it happened is part of the basic analysis, and finally advanced analysis know is what will happen next. See the model below:

There are different complexities to things within Analytics. Having a full grasp of each should be the goal.

Qualitative Analytics
As the data sets grow, it’s also important not only to get involved in just Data. There are two types of analytics, quantitative and qualitative that are extremely important that they work together. Marketing & Measurement Plans are the foundations to providing the successful analysis. There is a difference between succeeding and not succeeding in analysis, successful approaches well before deciding or thinking about the types of data, reports, tools, and analysis have well structured Digital Marketing & Measurement Plans.
Each Measurement plan should have Quantitative and Qualitative Objectives and KPI’s (Key performance Indicators). Qualitative is necessary to provide Voice of customer feedback to clickstream and other data sets. It often can confirm or deny your thoughts on what the data is telling.

Data Journalism
We know that data is powerful. But with a good story, it’s unforgettable. Data should always have a story. People play a powerful role in the process of gathering and interpreting information from different sources. The ability to make discoveries while swimming in massive sets of data is a necessity. Without the right people, the data would be meaningless graphs and charts, with no story or emotional connection. Most top organizations today are aware that in order to be a successful it requires skilled people such as analysts who bring about a data-driven culture.

Few organizations however, grasp how to use data correctly to tell a meaningful story that resonates both emotionally and intellectually with the target audience. People are the bridge between the mounds of aggregate data and those who need answers from it in order to make decisions.

Innovation
Analytics should be part of innovation. Often, Intuition is used alone, however intuition combined with Research and Quantitative/Qualitative Analytics is the key to reaching Innovation.

Google Analytics Premium vs. Google Analytics Free

Google Premium vs. Google

This question comes up a lot and happy to provide my thoughts. I always recommend that clients use two Web Analytics Solutions in order to validate data and consistency, albeit one needs to be the authority and get full attention in data governance and upkeep, while the secondary solution should probably not.

Google Analytics is a great product, in general it’s data outputs are better, graphs are more useful and segments are generally easier than SC even out of the box.  Google Premium, even more advanced and better looking features.  It is generally recommended for Enterprises and/or companies with very high traffic volume, typically. Looking at the benefits of Premium over the free version listed below:

1) Increased processing power. Premium supports up to 1 billion pageviews per month (while the free version processes 10 million per month). Comments: Not sure this is that beneficial, most sites are covered in the free version.
2) The Service Level Agreements. This is the arrangements between your company and Google Analytics for data guarantee.  Comments: So you will get your Data, 99% guaranteed.  I have not experienced this to be a problem, as log files are generally saved. This is also benefit of having two analytics systems, and you’d have to ask if there is any data with GA or SC that would be completely critical. 
3) Increased Segmentation Capabilities with custom variable. 50 custom variables with premium (the free version offers 5). Comments:  Do you have Segments already set up and use?  That could be the answer for Premium or not given the value and ROI of using that data.  This feature is beneficial given Segments are defined and actually used. Keep in mind a DMP/DSP will serve under one single cookie that you can sync with other solutions.
4) Data Driven Attribution modeling. The premium tool offers multiple attribution models,  you are able to create your own data model rather than settling for first-click, last click or manually input models offered ion the free version. Comments: This to me is the biggest benefit of GA Premium Given that this can be used on a regular basis, this is by far the most used feature for me.
5) Un-sampled reports.  Up to one million rows of un-sampled data can be viewed in the UI and downloaded (the free version includes 50,000 rows of data). Comments: Have you ever had an issue when 1 million rows were needed? 
6) BigQuery on-demand big data analysis engine.  Use BigQuery to process hit level data, including historical data, and merge with large external datasets Comments: Great feature if it can be used.  Many clients can’t use this because of their data collection and governance. We can see the benefits of using this given MD’s data sets. 
7) Integration with DoubleClick Campaign Manager Comments: Cool feature but may not be necessary given the DMP/DSP.
8) Quicker Data availability – 1–2 hours vs. 24 for free.  Comments: Given the Site Catalyst Data takes only 1-2 and will be the authority, I don’t see that much a benefit for this feature. 

That said;I recommend two routes  of discussion or thoughts…

1- I think the benefits of Google Analytics Premium will be a combination unique to your needs as an organization, a synergy that will be much more exciting than the generalized comments above.  So you can discuss the features that may be most useful or have not been used in the past and determine in the $150K investment will provide ROI.

2- Discuss moving the extra investment in Quantitative to Qualitative. Given the investment, there are other Digital Qualitative Analytics tools available such as Heat Mapping (Clicktale/Crazy Egg), Usertesting.com, Test and Target/Optimizely, 4Q, etc. that may provide additional insights that Quantitatively Premium will not be able to provide.  These tools provide a wealth of Qualitative data that can be extremely helpful and back up the quantitative data.

I hope this is helpful, please reach out of you have any additional questions.  

- Joshua 

Data Visualization

In speaking to a few colleagues, one of struggles we often see in good interface design (be it a report or a webpage) is the form versus function debate. We know that a webpage that does too much can look visually appealing and yet not convey information efficiently. What often happens is that the complexity of a page (web or a powerpoint slide) becomes so much that the beauty can be found in it as a whole piece of artwork (I don’t say that lightly as complexity is most often beautiful). The mind treats the page as a single “chunk” of information rather than its component parts. These component parts are often where the story is.

Visuals are often the best at breaking out complexity. Nonetheless, the simple, is can be the most efficient to process. I think one of the hardest things we have to do in our line of work is to determine whether or not a data narrative can be broken down into constituent parts for easy comprehension of the story OR, if in breaking it down we have changed the story too much. In the latter case we have to find the best info-graphic or visual to convey complexity (and that is fun objective to have).

I’m curious what strategies are used to determine how much to put into a visual or infographic. Are there any hard and fast rules out there anyone uses? I laugh slightly in this because I have noticed that our respective sub disciplines in analytics often inform our style. Everyone living in testing tends to take factor control to the extreme and create slides of extreme “whitespaciness” while those working in other areas tend to take be more comfortable with xtreme complexity (as they often should).

I’m under the impression that “data visualization” is purely a graphical representation of data while “infographics” are a form of visual communication that draw on data as well as other sources for information. creating accurate & engaging graphics. Anyone have another opinion?

This really isn’t a call out so much as a shameless exposition of my “everything is (are) data” worldview. I just thought others may have had something specific in mind. But your example would still be data… Maybe the distinction is qual versus quant?

One thought is, does qual break out of narrative into a spatial (graphical) presentation or stay in the words? Isn’t it the data that defines the approach? Is a spatial representation of data naturally quantitative. I say this as a quant researcher with tremendous respect for qual.

Thoughts?

Marketing & Measurement Plan Set up

Marketing & Measurement Plans are the foundations to providing the successful analysis. Period.

There is a difference between succeeding and not succeeding in analyzing marketing programs and campaigns, especially Web. Successful approaches well before deciding or thinking about the types of data, reports, tools, and analysis have well structured Digital Marketing & Measurement Plans.

The primary cause of failure is not having alignment with Objectives of a program, simply put.  If there is a lack of structured thinking about what the real purpose of the program/campaign… there will be a lack of measures with which to identify success or failure.  Success should always map back to objectives to let you know if you are reaching the objectives or not.

Developing Marketing & Measurement Plans are simple.  There is a  structured step process to infuse this much-needed thinking before a program launches.  I will try to summarize these in  XX steps.

Step 1: Gain Alignment on Objectives (Desired Outcomes)

The first step is to Identify the business objectives for the campaign or program.  Objectives are the outcomes you are trying to accomplish with a program.

You should be able to identify both Primary and Secondary Objectives as both show value.  Secondary objectives although may not map directly to the primary success of something, they add the additional value that makes a program

Thinking of it from a Macro and micro Conversion level…

Primary Objective  = The Desired Outcome = Macro Conversion

Secondary Objective = The additional important value a program adds = Micro Conversions

A generic example of a program Objective:  Generate increasing Online Sales

Another point to Objectives is alignment. Objectives need communication and alignment between all groups involved with the analysis of a program. If we don’t understand what we are aiming to achieve, the next steps won’t be clear.

Step 2 : Identify Strategies Used to Reach Objectives

Identify specific Strategies leveraged to accomplish business objectives. Strategies are not tactics, they could include tactics within them, but be careful not to rely on listing tactics.

Business Objective: XYZ needs to generate more sales Online

High level examples of Strategies used to  generate online sales

  • Drive more prospects to the site
  • Encourage items to be placed sales cart
  • Reduce the fallout of the steps in the sales cart abandonment
  • Try to re-engage people who fallout of sales care

Document these strategies, as this will come in handy later. 

Step 3 : Set Key performance Indicators (KPIs)

Identify the Key Performance Indicators. A key performance indicator (KPI) is a metric/measure that helps you understand how you are doing against your set objectives.  These are essentially the heartbeat of a program/campaign.  These Indicators say that something is wrong or right, succeeding or not.

Much of the data available for us does provide insight into if something is succeeding or not.  A lot of data out there can meaningless (especially without context), and we cannot generate insights with that data.  KPIs will provide some action for us, if a KPI is up or down we simply ask why, and go investigate what drove that increase or decrease.

KPIs are not the only thing you look at, but they will provide you with the initial context of success, and will allow you to dive deeper into the other metrics for conclusions.

Step 4: Set Goals and Benchmarks for the KPIs for additional analysis context. 

Set/create the Target Goals/Benchmarks/ Forecasts upfront by identifying targets for each KPI. A forecast helps us to determine where the KPI needs to be set at for a particular time or campaign.  Sometimes, if a forecast can not be generated, you can use benchmarks (current averages)  in order to show if you are above or below the normal performance level.  If you could use forecasts & benchmarks you are in.   Target goal add context to performance, they determine what is expected.  By the below example.  If you look at reporting, we would think the graph on the left means we are doing well, as long as things are going up right? .  However, if we had a target goal of 50 and we were not hitting that consecutively, we would know we are not succeeding.  All because we forecasted a target goal.

Data Target Goal


Tip:  Be sure to take into account factors such as seasonality and when forecasting.

 Step5: Set up Segments/Dimensions for the KPIs

For reporting and analysis to truly be beneficial, we cannot just show KPIs in aggregate and totals.  We need to slice numbers up to show the different dimensions/segments of a number.    For instance,  I can sale we generated 100 online sales.  But from where, of what, of how much?  I don’t have answers unless can slice up the 100 Online sales into these different dimensions.

Identify the different dimensions or segments of traffic, visitors, behavior, outcomes etc. that we’ll analyze to understand why we succeed or failed.  These dimensions will provide context and insight into what is driving the KPIs.

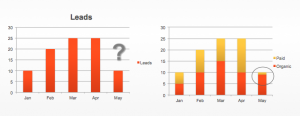
In the example below, if we just looked at the aggregate number of leads we would not know the Paid media was the cause for the may decrease.

Screen Shot 2013-10-04 at 4.19.21 PM

And finally, this also helps in overall reporting for the example

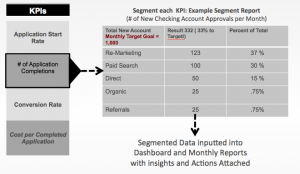
Data Segmentation

Segmenting Aggregate KPIs

I know this was a lot of information, but hopefully this will put something into perspective for you.  Please let me know your thoughts, comments or concerns.

Cheers,

Now Go Datatise….


Google Hidden Keywords

At the moment there is almost 100% disruption in Organic based keyword Analytics.  Moving forward with no signs of future change, we will still be able to track visits and conversions by the “Organic” source, but will not be able drill down to the ‘keyword’ granularity  through Google Analytics or any other Web analytics system.  So the ‘Organic’ source results will still be available.

As far as impact,  we expect there to be little impact at this point because there are work-arounds.  The impact does depends on the level of dependency of keyword-level data used to optimize a tactic, which we have done, however it’s not the only data-driven decision metric we have used.  While there is not a formula just yet for the lost search query data, there are a few recommendations that we are providing as work around that brands should use in both measuring Organic Search impact going and avoiding negative impact.  If we move forward with these suggestions we can definitely avoid negative impact.

1. Continue to leverage overall ‘Organic’ search metrics vs. digging into keywords

·  Monitoring Organic Search trends over time will provide insight into any impact, even if we can’t validate performance as granularly at the keyword level, we will be able to provide recommendations on optimizations on the channel

2.   Continue to Leverage Paid search trends and insights

·  While this is recommended regardless of secured search tracking, aligning keywords that drive efficient paid search volume with those in your organic search strategy is an easy win

3.   Utilize and Establish benchmarks within 3rd-party tools and resources

· Tools such as Search Monitor & SEO Moz provide insight into how search volume has increased and decreased, while providing forecasted results, even with competitors.

· Continue to Utilize Search Estimator tools to show share availability of Keywords, and optimize of based on potential results.

·  Google Webmaster Tools provides an aggregated list of the top 1,000 search queries that drove traffic to a site within the past 30 days and can highlight potential keyword trends. While this is not perfect, many companies are immediately diving into work with Webmaster tools.

4. Test & Learn

·  Need to Test Copy will be keys to finding out what Customers connect

5. Monitor Entrance pages via Google Analytics

· Setting up an Entrance Page report dashboard with the segment of ‘Organic Search’ only can help show if there is impact in organic Search and if SEO adjustments need to be made.  If pages start to drop in Rankings we will move to optimize based on keywords and Structure.

Social Media Measurement

Today’s Customer desires a conversation with a brand, brand loyalists, and friends in every channel.  In order to remain relevant, we must weave a web of integrated, multi-channel experiences to drive engagement that provides value to the customer, and this includes the social media space.

There is not yet a very ubiquitous or concrete way of measuring Social.  It is very different for each company.  There is a lot of debate on how to exactly measure social.  I am a firm believer that you must have a measurement plan in place before you start to track and analyze anything.  A measurement plan will ensure you track back to the objectives of the business.   Many people strongly suggest not measuring numbers in social.  Meaning fans, likes, comments, etc.. And while holds some truth, it’s not entirely.  You just have to know why your measuring those numbers to then analyze them in the correct way.  Numbers are not bad, unless you don’t know what they mean.  But before we get into that, I would like to discuss a few ways to think about social before you start to measure, these may help you find value in social measurement.

1) Synergy against Business Objectives and a company’s Marketing Efforts: Think of your companies objectives in Awareness/ Acquisition(Sales)/ Cross-Sell/ Retention& Loyalty.  Make sure you find valuable metrics that map back to these business & marketing objectives.  Social media can support & integrate multiple functions of a business.  Think of Customer Service.  If you haven’t read the case study on the impact of Continental Airlines sending out a letters after someone had a bad experience please do.  If your business objective is retention, you must find a way to show the impact of customer service outputs on social, similar to how you may with a call center and the cross-sell and retention factor impacted by Social media.

2) Domino Effect:  While this includes ‘Reach’, which is part of the Awareness objectives stated above, this also includes the affect on other channels.  Reach here indicates the amount of new customers you would get in this space due to your social presence.   Social channels can have a significant impact on other channels given the popularity and impact, especially on Search Engines (SEO) & Mobile.  eMail is also included in this category, think registrations.  Including social impact on other channels supports the overall reach of the platform.

3) Activity/Engagement of the social audience:  Activity generated in the social space is valuable.  As an owned platform for a company, customers will be there and can/should be active.  If they are active especially with a favorable sentiment, that may indicate what may bring someone into a loyal

The meaningful customer experience starts with awareness and runs through the journey. Capturing, aggregating, and analyzing data from all touchpoints enables us to understand the content, offers, communities and experiences that result in the greatest business value while delivering the best Customer experiences. Below is a step by step checklist on how to think of social.  If you follow it may help you in your Social Measurement.

Social Measurement Platform thought starters

Step 1: Identify  areas of Social Activities to measure in common categories

Reach (Some initial metrics you can look at in this category)

  1. Audience –  social audiences that are managed by a company
  2. Mentions – Company mentions (Segment suggestion: separating data in a defined region category will help analysis)
  3. Sentiment – favorability of mentions vs. non
  4. Engagement/Activity (Some initial metrics you can look at in this category)
  5. Social referrals to brand site – managed and natural visits
  6. Social content interactions – users likes, RTs, comments, etc.
  7. Ability to segment data by:
  8. Target audience (Race, Repeat customers, owners, non-owners etc.)
  9. Topic of content ( lifestyle, Entertainment, Funny etc.)
    1. Platform (Facebook, twitter, Youtube, blog, etc.)

Perform/Outcomes (Some initial metrics you can look at in this category)

  1. Customer Service Response Rate – support requests responded to (%)
  2. Sentiment Analysis – review health of customer service social content
  3. Issue Identification – identify trending issues, share with stakeholders
  4. Social driven New Account/Sales Indicating Activities – volume, rate from social referrals to brand site who start and complete and app and use tools, make a sale, give their email, convert in some sort of way based on what your website is set up to do.
  5. Optimize to sales indicating activities by:
  • Natural and Managed social media
  • Target audience
  • Campaign type
  • Platform
  • Region

Step 2: How to Implement? Steps to Social Measurement Implementation

Deriving business value while offering meaningful customer experiences depends on intelligence: robust customer information collected in a CRM fused with insights about on-site and off-site Customer behaviors.  Customer intelligence depends on dynamic data capture:

  1. Social Measurement Plan – Define KPIS (key performance indicators)  and Segments
    1. Secure Buy In of All KPIsIntegration with Web Analytics System (Site Catalyst, Google Analytics, WebTrends etc.)
    2. Social traffic source segmentation set up and tagging
    3. Provide & Share governance for media tagging and content publishing
    4. Social Listening Product Implementation (variety of tools can be selected)
      1. Refine target keywords, filter for consumer-generated content
      2. Social Publishing Application (variety of tools can be selected)
        1. Define measurement by platform and broadcast
        2. Report Building / Dashboard Creation (Excel /Dashboard tools)
          1. Develop a dynamic set of reports on a defined Frequency
          2. Data Governance Set up
          3. Issue identification (cluster / emerging trend analysis)
          4. Customer service and social media best practices

Step 3: How to get the data – Reporting.

  1. In-Market / Regional Team Meetings
    1. Frequent review of metrics, insights, and issues with stakeholders
    2. Regular Reporting
      1. Refresh and review weekly, monthly and quarterly reports
      2. Deliver insights and recommendations to stakeholders
      3. Ad-hoc Report Creation
      4. Audit specific components of the social measurement process
      5. Review individual campaign or market performance
        1. Respond to reporting requests from stakeholders
        2. Log Changes & Performance optimization

Step 4: Optimization

  1. Drive New Accounts through data driven optimization of existing social strategies.
  2. Improve Customer Service through social interactions with customers.
    1. Surface actionable insights to stakeholders
    2. Deliver a specific strategy to optimize engagement, sales, or customer service
      1. Trend data to demonstrate the effect of strategy changes
      2. Multi-Message and Creative impact
      3. Share best practices with other regions/markets (If Applicable)
        1. Enable regions in earlier stages of maturity model to mature with the training and direction of other regions

Website Testing

Testing a Website?  How do you decide what to test first?

Before you start to dig up some test ideas, usually you may want to step back and ask, “What is this Web site really trying to accomplish?” Generally, you get some great answers that way.  Through those answers, you can generally find areas of focus.  Here are some quick areas that often rise up to the top for starting out top.

Biggest Business Impact  – This is often the conversion process.  Applications, lead forms, carts or checkout process. you what this to be the most efficient and optimized process as possible.

High Impact Pages - What can also be landing pages, for Search Engines and Navigational direction.  The pages that often receive the highest amount of traffic.  If you could reduce a bounce rate or increase an application/checkout start % that means a a larger prospect pool into your conversion funnel.  Better chances to assist business impact .

Customer Pain Points - Anywhere you find bottlenecks (click backs, internal searches) or loss of visitors.  Navigation, paths, additional clicks, pop ups, etc.  Test and really survey the website to better serve your customers.  There are lot’s of tools that can help getting insights for these types of tests.

Paid Media Landing Pages -Pages you may specifically be using to drive paid media offers, especially for Search or Display.  This can apply to social home pages as well.  Changing images and content (calls to actions) work.

All in all, anything could be tested, just may be a good idea to focus on what matters most… first